Published on November 3, 2016
6 min read
Publish code coverage report with GitLab Pages
Publish code coverage report with GitLab Pages

At GitLab, we believe that everyone can contribute. We also use automated testing extensively to make contributing to GitLab easier. Using automated testing is a great way to improve confidence when someone needs to change the code, which actually is the case in the majority of contributions to software projects.
But how do we ensure that our test suite covers enough to aid the confidence in changing behavior of the software, and what can we do to keep on improving it?
What is code coverage?
Using the code coverage metric is a technique that helps to improve the test suite, development process, and the software itself.
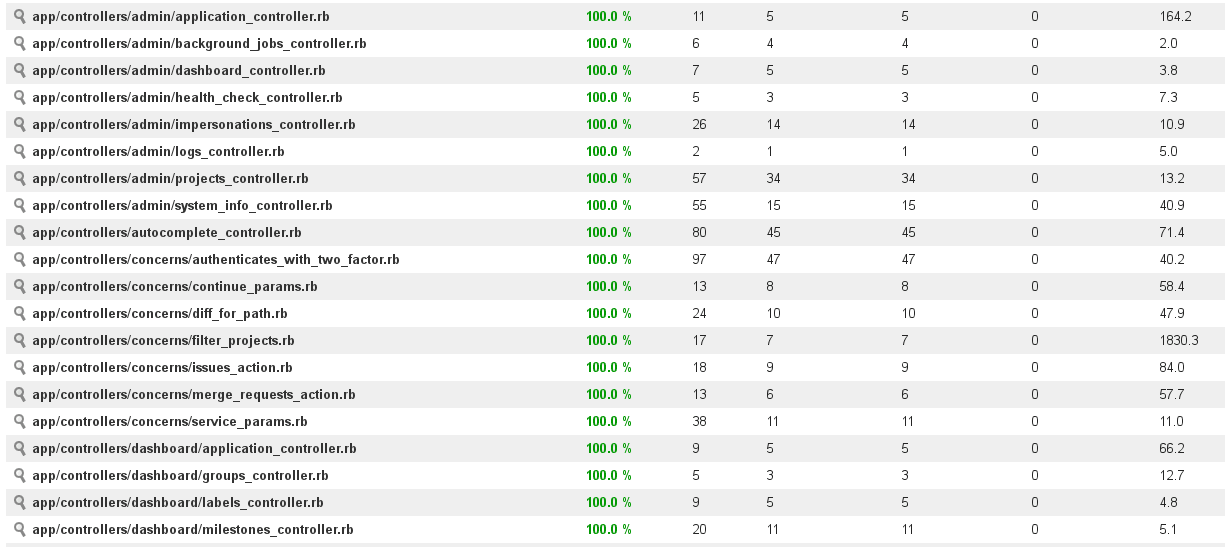
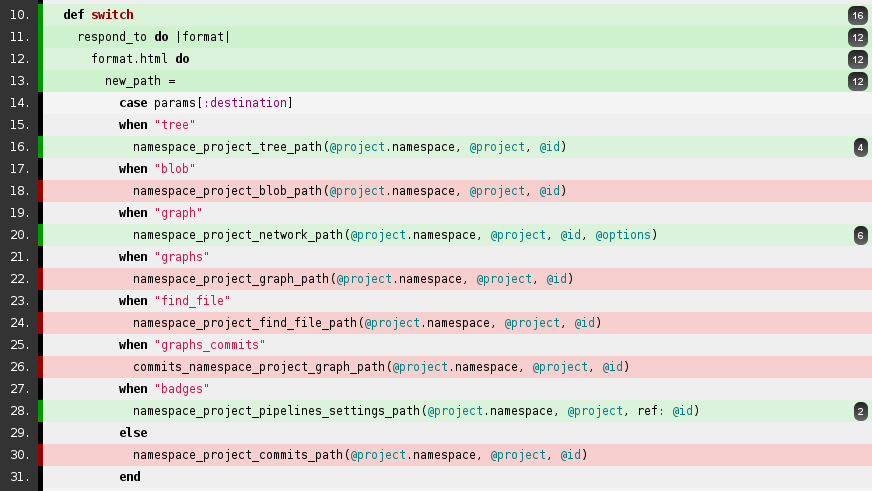
Tools used to measure the code coverage percentage usually extend the test harness environment and make it possible to map the application execution process back to the source code while automated tests are being executed. With that approach, you can not only learn how much of your code is covered by tests, but it is also possible to find out what exact parts of the codebase are not covered well enough.
Some coverage analysis tools also make it possible to generate code coverage reports in HTML format that you can then view in your browser. It makes it much easier to inspect the areas of code that are missing tests and are likely to need some improvements as well.
You can take a look at the Ruby code coverage report for GitLab that is hosted on GitLab Pages.

How to generate a code coverage report
There are a lot of code coverage tools available for many different languages, and you will need to find the most appropriate option for your particular needs. At GitLab, with projects using Ruby, we often use SimpleCov.
You will need to check the documentation for your tool of choice to learn how to generate the code coverage report. Once you are able to do this locally, check out the rest of this tutorial to learn how to publish the report with GitLab Pages!
For the sake of this example, we will assume that you are using Ruby with RSpec and SimpleCov.
How to configure your tools
Configuring SimpleCov can be as simple as extending your spec_helper.rb with:
require 'simplecov'
SimpleCov.start
When you run the rspec command, you will notice the code coverage report being
generated when tests are completed. The RSpec example below comes from a very simple
code that contains a single test for the single class that is there:
spec/dog_spec.rb
describe Dog do
  it 'barks' do
    expect(subject.bark).to eq 'Woof, woof!'
  end
end
dog.rb
class Dog
  def bark
    'Woof, woof!'
  end
end
And the RSpec test harness output is:
Dog
  barks

Finished in 0.00058 seconds (files took 0.08804 seconds to load)
1 example, 0 failures

Coverage report generated for RSpec to /tmp/coverage_example/coverage. 6 / 6 LOC (100.0%) covered.
At the end of the output, you can see that code coverage report was generated
to the coverage/ directory whose contents look like:
$ ls coverage/
assets/ index.html
Yes! This is an HTML code coverage report that we can publish with GitLab Pages!
GitLab CI configuration
Take a look at our documentation
to learn more about how to use .gitlab-ci.yml.
The GitLab CI configuration can be defined in .gitlab-ci.yml file. Let's go
through the configuration that is necessary to publish coverage report with
GitLab Pages.
1. Run the RSpec test suite first
The most simple approach is to execute all tests within a single job in the CI pipeline:
image: ruby:2.3

rspec:
  script:
    - bundle install
    - rspec
2. Store the result as build artifacts
image: ruby:2.3

rspec:
  script:
    - bundle install
    - rspec
  artifacts:
    paths:
      - coverage/
Let's see if artifacts were stored correctly using build artifacts browser that is available from the build sidebar. It is there!

3. Finally, publish with GitLab Pages
Follow the documentation about how to use GitLab Pages.
image: ruby:2.3

rspec:
  stage: test
  script:
    - bundle install
    - rspec
  artifacts:
    paths:
      - coverage/

pages:
  stage: deploy
  dependencies:
    - rspec
  script:
    - mv coverage/ public/
  artifacts:
    paths:
      - public
    expire_in: 30 days
  only:
    - master
A job that is meant to publish your code coverage report with GitLab Pages has
to be placed in the separate stage. Stages test, build and deploy are
specified by default, but you can change that if needed. Note that you also
need to use pages as a job name.
Using the dependencies keyword, we tell GitLab to download the artifacts stored
as part of the rspec job. You also need to rename the directory from coverage/
to public/ because this is the directory that GitLab Pages expects to find
static website in.
It makes sense to deploy a new coverage report page only when the CI pipeline
runs on master branch, so we added the only keyword at the end of the
configuration file. This will also expire artifacts after 30 days, what does
not affect coverage report that has already been published.
How to run parallel tests
Things get a little more complicated when you want to parallelize your test suite.
GitLab is capable of running tests jobs in parallel and you can use this technique to decrease wall-clock elapsed time that is needed to execute all tests / builds in the CI pipeline significantly.
Numerous approaches are available, the most simple being to split test manually, whereas the more sophisticated is to use tools or plugins that do distribute the tests jobs evenly in the automated fashion.
Should you decide to parallelize your test suite, you will need to generate a partial code coverage report in each parallel job and store it as a build artifact. Then, you will need another stage in the pipeline with a job that merges the partial code coverage metrics into the previous one and generates a single report that takes all results (generated during parallel jobs) into account.
At GitLab, we parallelize our test suite heavily, and we do use additional tools to distribute the test jobs evenly. SimpleCov does not support merging result sets out-of-the-box, so we had to write a patch for it. There is an issue about contributing this change back to the SimpleCov.
How to deploy coverage report as GitLab Pages
When you push your changes in .gitlab-ci.yml to GitLab for the first
time, you will see new jobs in the CI pipeline.

If the pages:deploy job has been successful, the status icon for it is green.
This means that you can access you coverage report page using a URL like
http://group-path.gitlab.io/project-path, for example
https://gitlab-org.gitlab.io/gitlab-ce.
That way, a new coverage report will be published each time you push new code to GitLab!
How to use the code coverage report badge
Once you have the code coverage report published with GitLab Pages, you may want to
put a link to it somewhere. We recommend using the code coverage badge that you
can add to your README.md file for that purpose.
This is how it looks in our README.md.

When someone clicks the coverage badge, the code coverage report page will be opened. The Markdown source is as follows:
[](http://gitlab-org.gitlab.io/gitlab-ce/coverage-ruby)
You can find more info about report badges and the other types of badges in our documentation.
Summary
Although the code coverage technique is great for revealing untested code and improving overall coverage, it is not a great metric to tell how good the tests are, but it helps people to contribute.
With GitLab, you can create simple software that it is easy to contribute to!
We want to hear from you
Enjoyed reading this blog post or have questions or feedback? Share your thoughts by creating a new topic in the GitLab community forum.Share your feedbackFind out which plan works best for your team
Learn about pricingLearn about what GitLab can do for your team
Talk to an expert
