"Whenever there is a product for a customer, there is a value stream. The challenge lies in seeing it!" Learning to See - Shook & Rother
Every company today is a software company so the level of innovation and delivery has a direct impact on revenue generation. In order to be successful, businesses must deliver an amazing digital experience, keep up with the latest technologies, deliver value at the speed demanded by customers, and do it all with zero tolerance for outages or security breaches. That's where value stream management comes into play.
“If you can’t describe what you are doing as a value stream, you don’t know what you’re doing.” (Martin, K. & Osterling, M. (2014). Value Stream Mapping. McGraw-Hill, p. 15.)
Value stream management(VSM) is a change in development mindset that puts the customer at the center. VSM allows teams to measure and improve the software delivery and value flow to customers. The development process is outlined from ideation until customer value realization. The focus is no longer on features and functionality – instead, organizations ensure the efforts and resources invested to deliver value to customers will improve flows that are causing bottlenecks, optimizing the cycle and shortening time to market.
You can learn more on Value Stream Mapping here
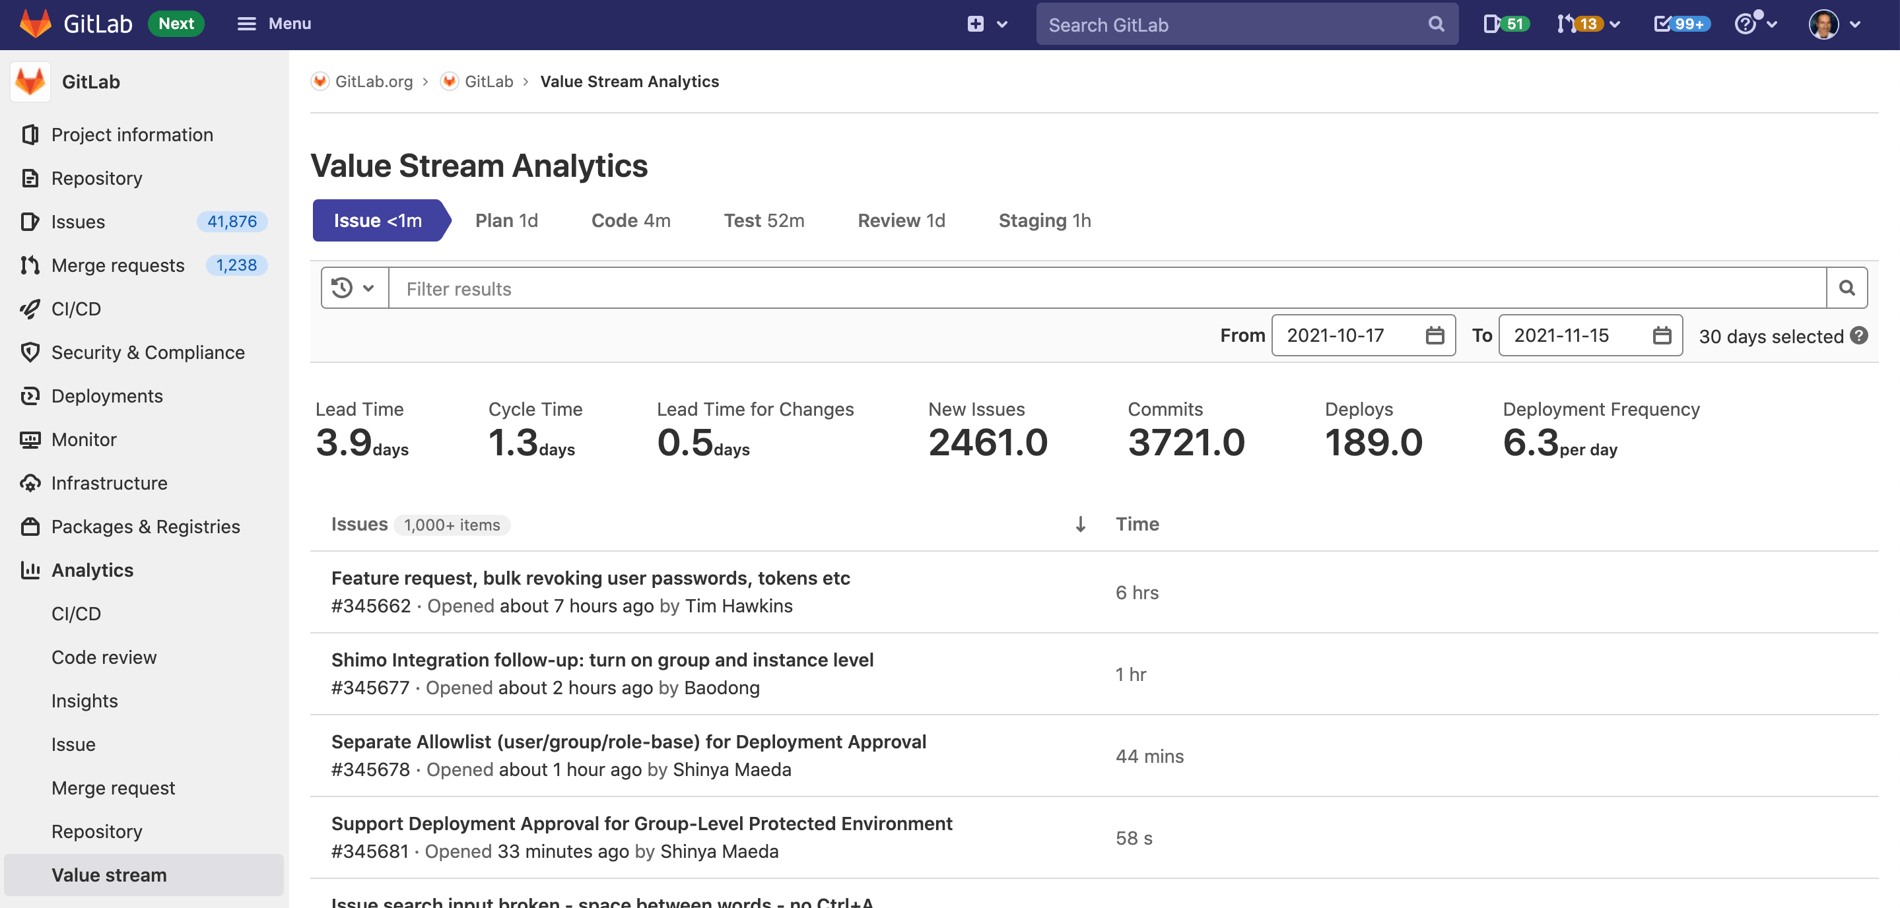
An overview of GitLab's Value Stream Analytics
As part of GitLab's DevOps Platform, Value Stream Analytics provides one shared view of the team's velocity. With insights into how long it takes the team to move from planning to monitoring, it's possible to pinpoint areas for improvement. Value Stream Analytics measures the time spent for each project or group. It displays the median time spent in each stage of the process by measuring from its start event to its end event. It helps identify bottlenecks in the development process, enabling management to uncover, triage, and identify the root cause of slowdowns in the software development life cycle and to quickly act on them to improve efficiency.

Why are Value Stream Analytics important?
The process of efficient software delivery starts by understanding where the slowest parts are, and what are the root causes behind them. With this information it's possible to build a plan for optimization.
Which DevOps stages are tracked?
The stages tracked by Value Stream Analytics by default represent GitLab's DevOps Platform flow - Issue, Plan, Code, Test, Review and Staging.

How to customize GitLab's Value Stream Analytics
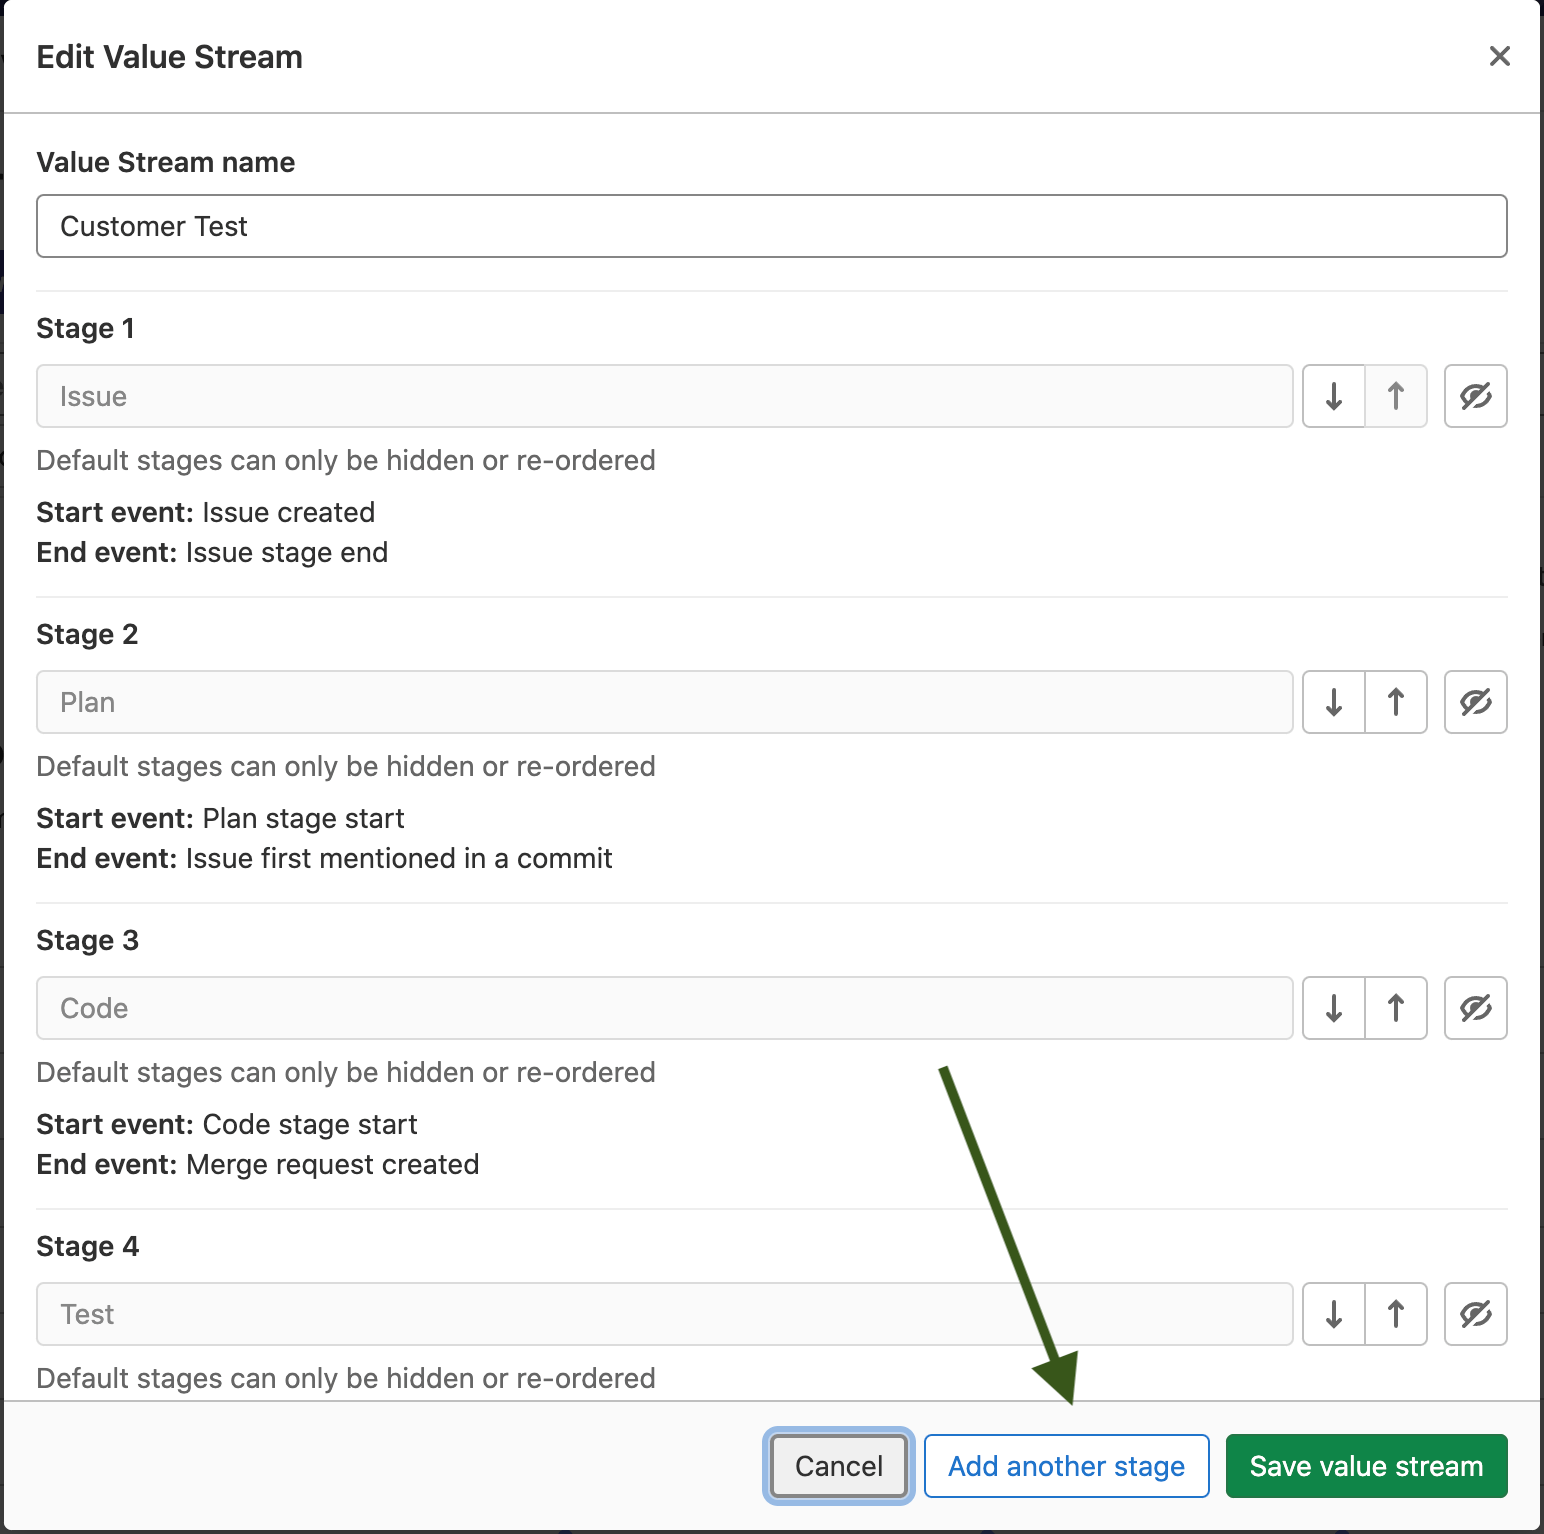
Note: The stages can be customized in group evel Value Stream Analytics; currently no customization is available in the project level.
Click Edit in the Value Stream Management

Click Add another stage

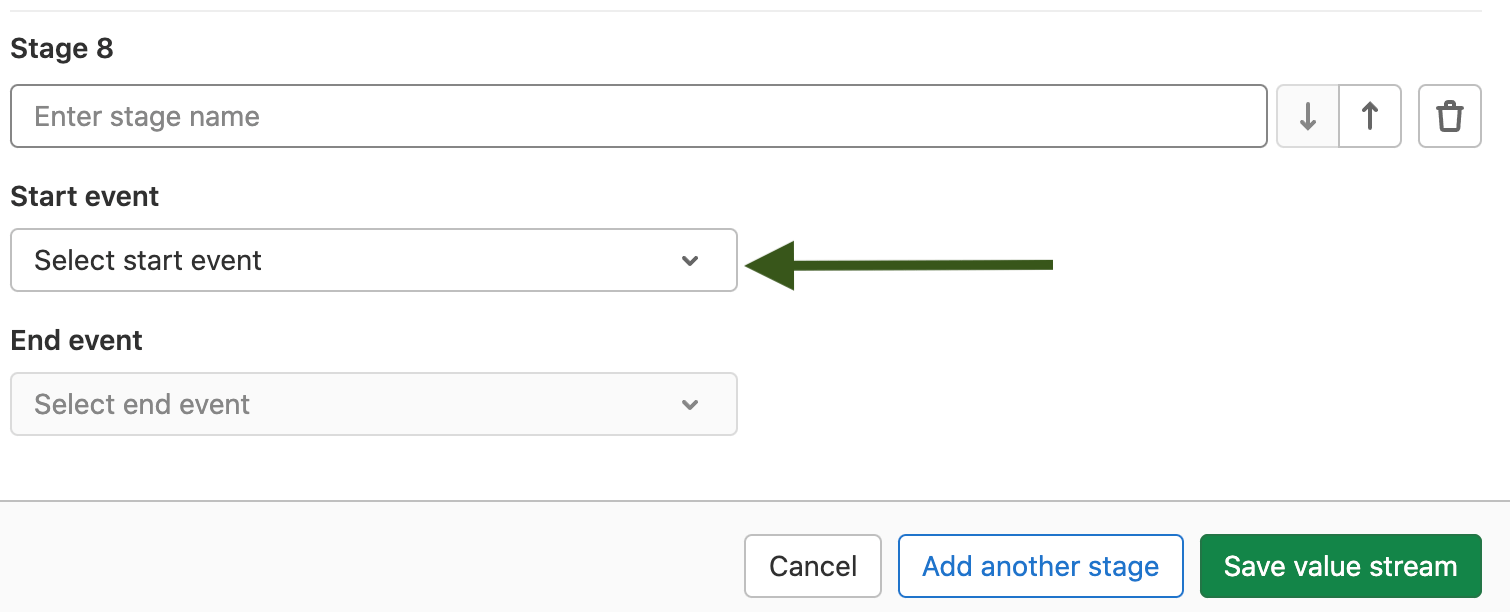
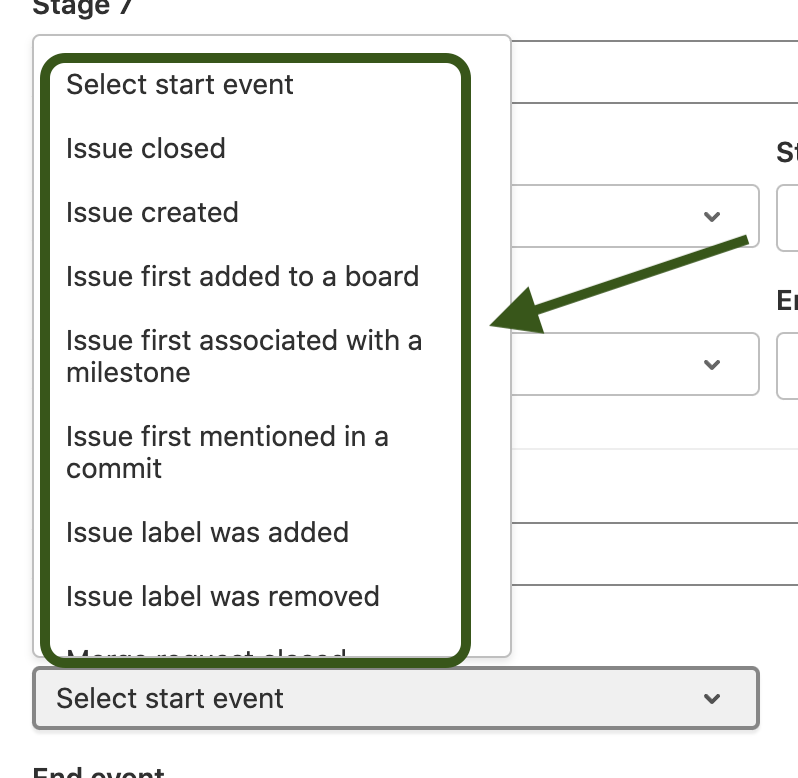
Define stage name, and select start event and end event from the list.


The key metrics
The dashboard includes useful key metrics which help to understand the team performance. If, for example, the values of new issues, commits and deploys are high, it's clear a team is productive. The DevOps metrics commonly known as the DORA (DevOps Research and Assessment) 4. The DORA 4 metrics show the value the team delivered to customers.
Deployment Frequency shows how often code is deployed to production and brings value to end users. Lead time for changes measures how long it takes a change to get into production. Like deployment frequency, this metric measures team velocity.

The importance of Value Stream Analytics within GitLab
GitLab is a complete DevOps Platform, delivered as a single application. As such, teams use the same application during the development process from planning to monitoring. One of the benefits of being a single application for the entire DevOps lifecycle is that the data flows from all DevOps stages and is available for analysis, so Value Stream Analytics correlates and identifies how teams are spending their time without the need to integrate with an external tool.
Learn more about Value Stream Analytics for projects and Value Stream Analytics for groups.
Take a deeper dive into what DORA calls elite DevOps teams.


