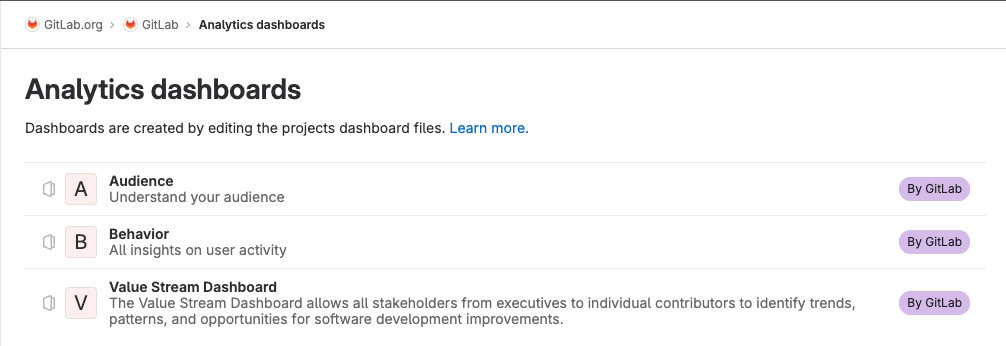
To best understand how your features being developed and shipped are helping you meet your goals, you need data. The previously announced Product Analytics feature set helps our customers do just that by providing tools to instrument code and process and visualize the data – all within GitLab.
Privacy first
We know customer privacy is a big concern for our customers and our customer's customers. As we said in our announcement blog:
Nothing about that approach has changed and it is too important not to mention again.
Customer Zero and the biggest customer
We are progressing quickly towards the open beta for Product Analytics. We are currently feature-complete for the beta with the managed product analytics stack, five existing SDKs for instrumentation, default dashboards, and the recently released improved Dashboard and Visualization Designer experiences. We are also learning more about what problems our internal users still have that they cannot solve with Product Analytics.
As we prepare for the Beta release of Product Analytics, it is important for us to know how the Managed Product Analytics stack will stand up to a bigger event load than we are getting from the initial customers and internal users. With our commitment to dogfooding, adding more internal projects was the obvious answer, so we worked with more internal teams to add instrumentation for the Metrics Dictionary and GitLab Design System sites.
Instrumenting internal projects gave us additional feedback about the setup of Product Analytics and the usefulness of the Audience and Behavior Dashboards, showing how many users were visiting and what pages they visited. These gave us great insights into the usefulness of Product Analytics, but did not provide the volume of events we needed to really stress test Product Analytics at the scale we wanted.

At the same time the Analytics Instrumentation team was hard at work developing an event framework to make instrumentation easier for GitLab developers. This lets the GitLab teams create new features and update existing ones faster to understand how changes impact our users. This also made it much easier and faster to add Product Analytics to GitLab.com, which provided the event volume that would stress test the Product Analytics stack so we could validate our assumptions.
Once fully enabled, with all page views and events going to the Managed Product Analytics stack, we saw a 17x increase in load above all other internally instrumented projects, receiving over 20 million events a day. That is a lot of events!
By instrumenting GitLab.com, we were able to see the stress cracks in our infrastructure before introducing the features to users in our Beta. We were able to validate our scaling strategies, identify and resolve query performance concerns, improve the onboarding experience for our upcoming Beta program, and plan future improvements as we work towards general availability.
We have also proved to ourselves that Product Analytics can stand up to future customer load without making customers suffer through outages or slowness as we make the stack better.
What’s next for Product Analytics
Throughout the internal release and the experiment phase, we have been talking to customers about what is and is not working with Product Analytics, especially the built-in dashboards. From that feedback we have a number of improvements in mind that can't all fit here but check out our Product Analytics direction page to see the latest on what improvements are coming next.
Talking directly with users of Product Analytics is also informing the next iterations of other features like Customizable Dashboards and Visualization Designer. The team is also exploring ways to leverage AI to make it easier to find and understand Product Analytics data.
Share your feedback
It is an exciting time in product analytics and we cannot wait for you to try the feature out yourself! You can add ideas or comments to our feedback issue. We look forward to hearing from you!


